Viewing DINAMITE traces with TimeSquared.
10 Mar 2017In this blog post we describe how to view DINAMITE traces using TimeSquared.
In the previous post we described how to query DINAMITE traces using a SQL database.
If you would like to get an idea of what the output of TimeSquared will look like, check out the demo. Just click on any button under ‘Sample Data’.
Pre-requisite: You will need to set up the database as described in that post and try the example queries, because TimeSquared interfaces with the database to show portions of the trace.
Set up TimeSquared:
   # Clone the repository
   % git clone https://github.com/dinamite-toolkit/timesquared.git
   % cd timesquared

   # Install all dependent modules
   % npm install
   % npm install monetdb

   # Start the server
   % cd timesquared/timesquared
   % node server.js
If you are using the settings for MonetDB other than the ones recommended in
our previous post, modify
timesquared/server/TimeSquaredDB.js to reflect these changes. The default
options look like these:
   var MDB_OPTIONS = {
   host : 'localhost',
   port : 50000,
   dbname : 'dinamite',
   user : 'monetdb',
   password : 'monetdb'
   };
As you can see, they reflect the same database name, user name and password, we used for MonetDB.
If your server ran successfully, you will see a message like this:
TimeSquared server hosted on http://:::3000
Open your browser and type the following for the URL:
Click on the "Dashboard" button. You will see a textbox, where you can begin
typing SQL queries to visualize parts of the trace.

Suppose that after reading the [previous
post](/2017/03/10/querying-dinamite-traces) you want to generate a portion to
the trace corresponding to the time when a function of interest took a
particularly long time to run. Suppose that you found, using the query `SELECT *
FROM outliers ORDER BY duration DESC;` that the ID of your "outlier" function
invocation equals to 4096.

Type the following query into the query box and press the "Query" button.
with lbt as (select time from trace where id=4096 and dir=0), ubt as (select time from trace where id=4096 and dir=1) select dir, func, tid, time from trace where time>= (select time from lbt) and time<=(select time from ubt) ```
The browser will open another tab where it will try to render the results of your query. You can watch the console where you started the server for any log messages indicating the progress, or error messages. If there are too many records in the result of your query (e.g., >500K), the rendering will take a long time and may even crash the browser. In that case, try limiting the number of records returned by adding the ‘LIMIT’ command to the end of the query. For instance, to limit the results to 100,000 records, append ‘LIMIT 100000’ to the query above.
Once rendering is complete, you will see a succession of callstacks over time, for each thread. Time flows on the horizontal axis, threads and callstacks are along the vertical axis, like so:
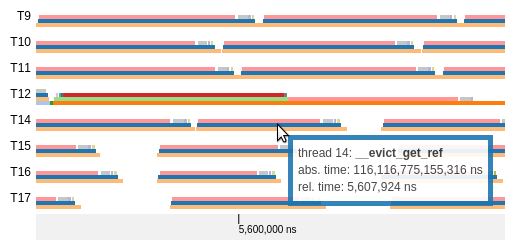
If you hover with the mouse over a coloured strip in the callstack, TimeSquared will show you the name of the function and some information about it.
If you want to see what the TimeSquared output will look like you can
TimeSquared is work in progress. We are working on building an interface to effectively navigate very large traces. At the moment TimeSquared cannot show too many events – and even if it could, you’d hardly want to look at all of them. We will report on these features in our future blog posts.