Trace analysis tools
FlowViz
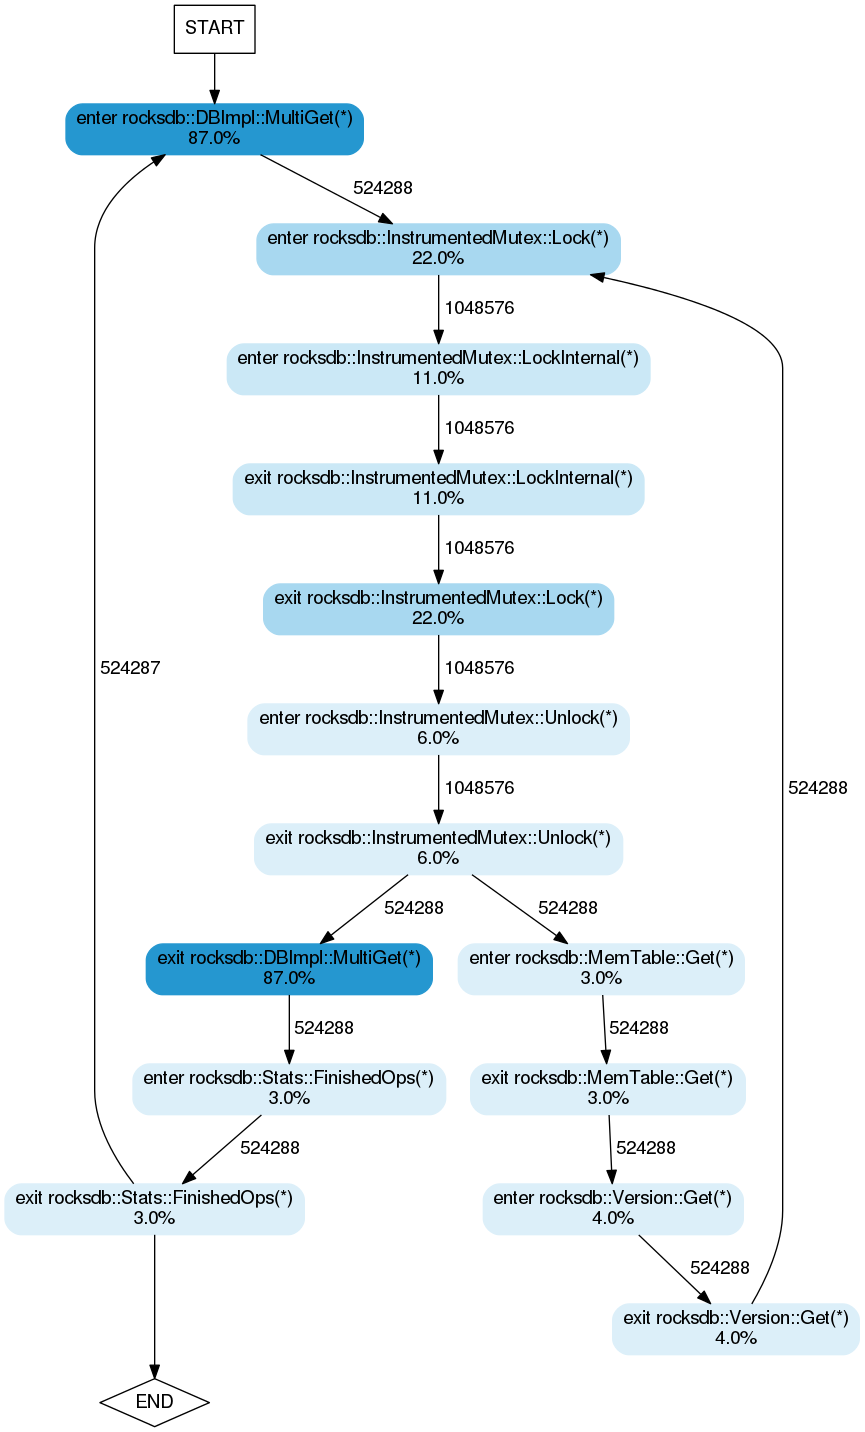
FlowViz visualizes the execution trace in a form of an execution flow diagram, such as the one shown below. Each function entry and exit point is a node in the graph, and edges show the number of transitions. Nodes are coloured and annotated according to how much execution time they and their children took.
To find out how to generate FlowViz diagrams from DINAMITE traces, take a look at this technical article.
TimeSquared
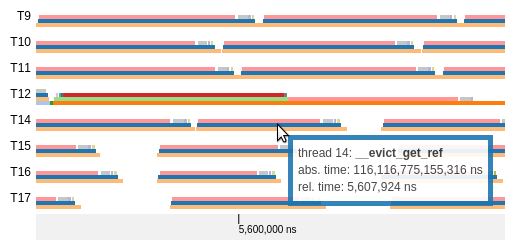
TimeSquared allows you to examine execute traces over time. It uses novel techniques to help you navigate very large execution traces, discover key execution patterns and query the trace. For a demo of TimeSquared click here.
In its most simple form, TimeSquared shows per-thread callstacks over time, like so:
TSViz
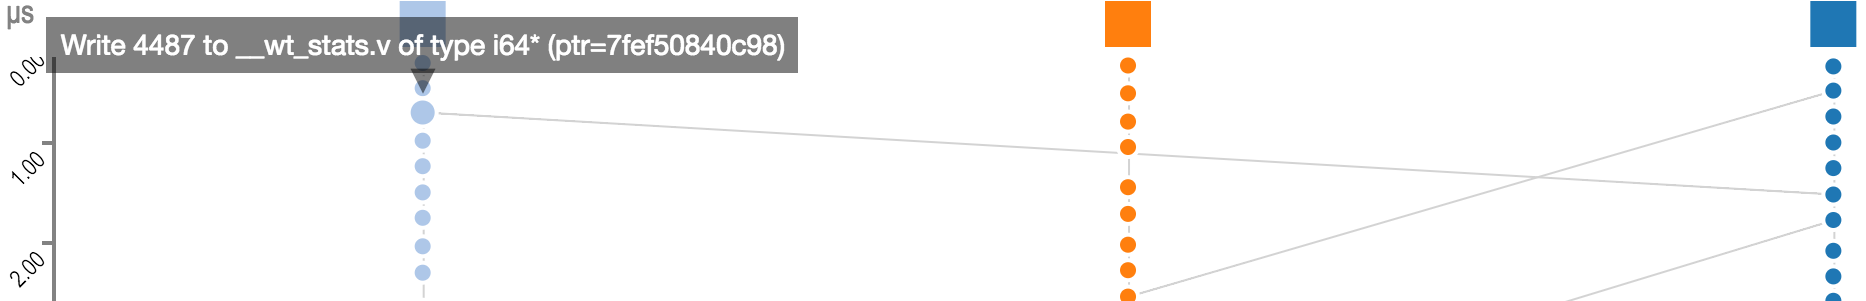
If you’d like to examine how threads interact at a very fine granularity, for instance to detect lock contention or shared variables, you can use TSViz. Click here for a TSViz demo.
DataViz
DataViz will bring to you a comprehension of data structures used in the program, as well as their performance properties. When DataViz is ready, you will be able to see what data objects are used in the program, how they are connected, how they affect performance and how you can change your data structures to improve performance.